Kepler.gl
Group Information
Group number - J061
Group Topic: Kepler.gl
One line description-Geospatial visualizations with a no-code interface.
Introduction:
Kepler.gl is a WebGL-powered, open-source tool for displaying massive amounts of geographical data. It was created by the Visualization team of Uber and allows users to rapidly and simply generate interactive maps without needing to know a lot of code. Kepler.gl automatically processes datasets and creates beautiful visuals using an easy-to-use drag-and-drop interface.
Its robust features, which include time-based animations, support for many layers, and 3D mapping, make it perfect for uses in environmental studies, transportation analysis, and urban planning. Kepler.gl offers a smooth method for exploring, analyzing, and sharing location-based insights, regardless of your background as a data scientist, researcher, or analyst.
Installation & Setup:
Kepler.gl may be used directly in a web browser or built into a web application, and it is simple to set up. Below are the different ways to install.
1. Using Kepler.gl Online (No Installation Required)
The simplest way to use Kepler.gl is through its web application: Visit Kepler.gl
Click “Get Started” to launch the tool.
Upload a dataset (CSV, JSON, or GeoJSON).
Customize and explore your geospatial data.
2. Installing Kepler.gl in a React App
Step 1: Installation
Use Node v18 and above, older node versions have not been tested
npm install --save kepler.gl @kepler.gl/components @kepler.gl/reducersGet Mapbox Token
Kepler.gl is built on top of Mapbox GL. A mapbox account and an access token are needed to use kepler.gl in your app. Get a Mapbox Access Token at mapbox.com.
1. Working Template
import * as React from "react";
import ReactDOM from "react-dom/client";
import document from "global/document";

import { applyMiddleware, combineReducers, compose, createStore } from "redux";
import { connect, Provider } from "react-redux";

import keplerGlReducer, { enhanceReduxMiddleware } from "@kepler.gl/reducers";
import KeplerGl from "@kepler.gl/components";

import AutoSizer from "react-virtualized/dist/commonjs/AutoSizer";

const reducers = combineReducers({
  keplerGl: keplerGlReducer.initialState({
    uiState: {
      readOnly: false,
      currentModal: null,
    },
  }),
});

const middleWares = enhanceReduxMiddleware([
  // Add other middlewares here
]);

const enhancers = applyMiddleware(...middleWares);

const initialState = {};
const store = createStore(reducers, initialState, compose(enhancers));

const App2 = () => (
  <div
    style={{
      position: "absolute",
      top: "0px",
      left: "0px",
      width: "100%",
      height: "100%",
    }}
  >
    <AutoSizer>
      {({ height, width }) => (
        <KeplerGl
          mapboxApiAccessToken="xxx" // Replace with your mapbox token
          id="map"
          width={width}
          height={height}
        />
      )}
    </AutoSizer>
  </div>
);

const mapStateToProps = (state) => state;
const dispatchToProps = (dispatch) => ({ dispatch });
const ConnectedApp = connect(mapStateToProps, dispatchToProps)(App2);
const Root = () => (
  <Provider store={store}>
    <App2 />
  </Provider>
);

export default Root;
2. Mount reducer
Kepler.gl uses Redux to manage its internal state, along with react-palm middleware to handle side effects. Mount kepler.gl reducer in your store, apply taskMiddleware.
import keplerGlReducer from '@kepler.gl/reducers';
import {createStore, combineReducers, applyMiddleware} from 'redux';
import {taskMiddleware} from 'react-palm/tasks';

const reducer = combineReducers({
  // <-- mount kepler.gl reducer in your app
  keplerGl: keplerGlReducer,

  // Your other reducers here
  app: appReducer
});

// create store
const store = createStore(reducer, {}, applyMiddleware(taskMiddleware));
3. Mount component
import KeplerGl from '@kepler.gl/components';

const Map = props => (
  <KeplerGl
      id="foo"
      mapboxApiAccessToken={token}
      width={width}
      height={height}/>
);
4. Add data to map
You may dispatch the addDataToMap action from anywhere in your application to interact with a kepler.gl instance and add new data to it. It refreshes the entire setup (mapState, mapStyle, visState) and adds dataset(s) to a kepler.gl instance.
import {addDataToMap} from '@kepler.gl/actions';

this.props.dispatch(
  addDataToMap({
    // datasets
    datasets: {
      info: {
        label: 'Sample Taxi Trips in New York City',
        id: 'test_trip_data'
      },
      data: sampleTripData
    },
    // option
    option: {
      centerMap: true,
      readOnly: false
    },
    // config
    config: {
      mapStyle: {styleType: 'light'}
    }
  })
);
Key Features & Explanation:
Kepler.gl is a powerful and user-friendly tool for geospatial data visualization. Here are its key features:
1. Easy Data Import & Automatic Processing
Supports CSV, JSON, and GeoJSON formats.
Automatically detects geographic fields like latitude and longitude.
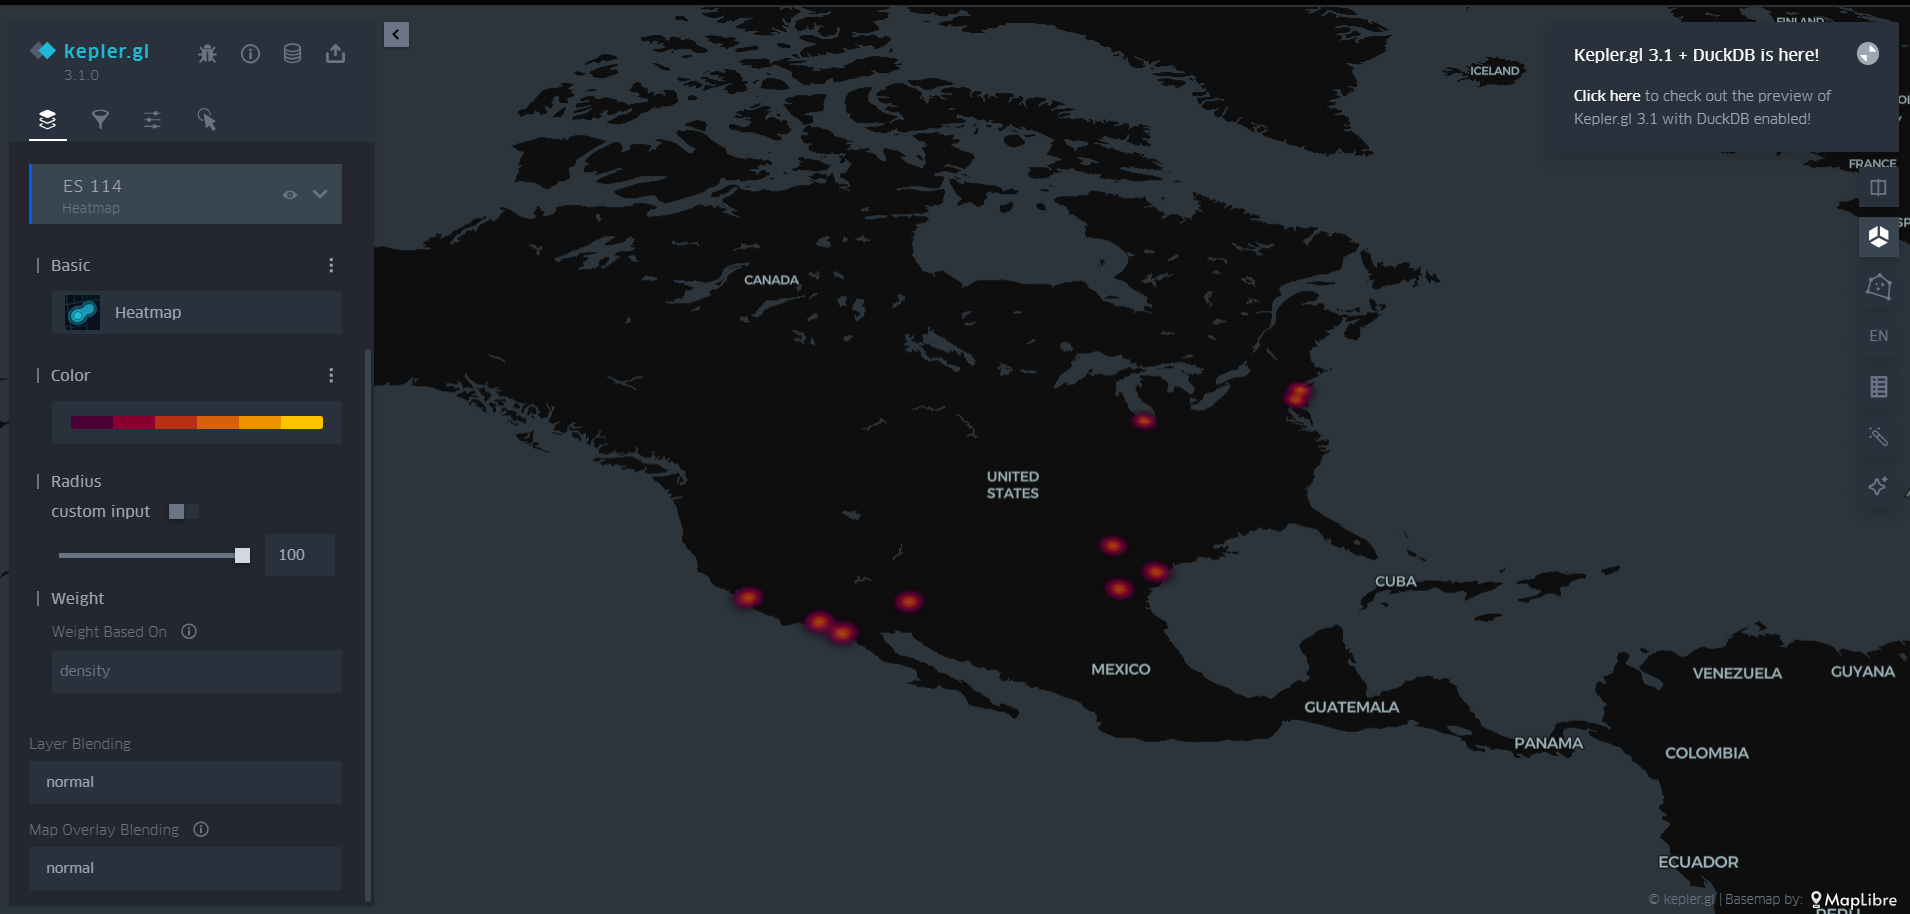
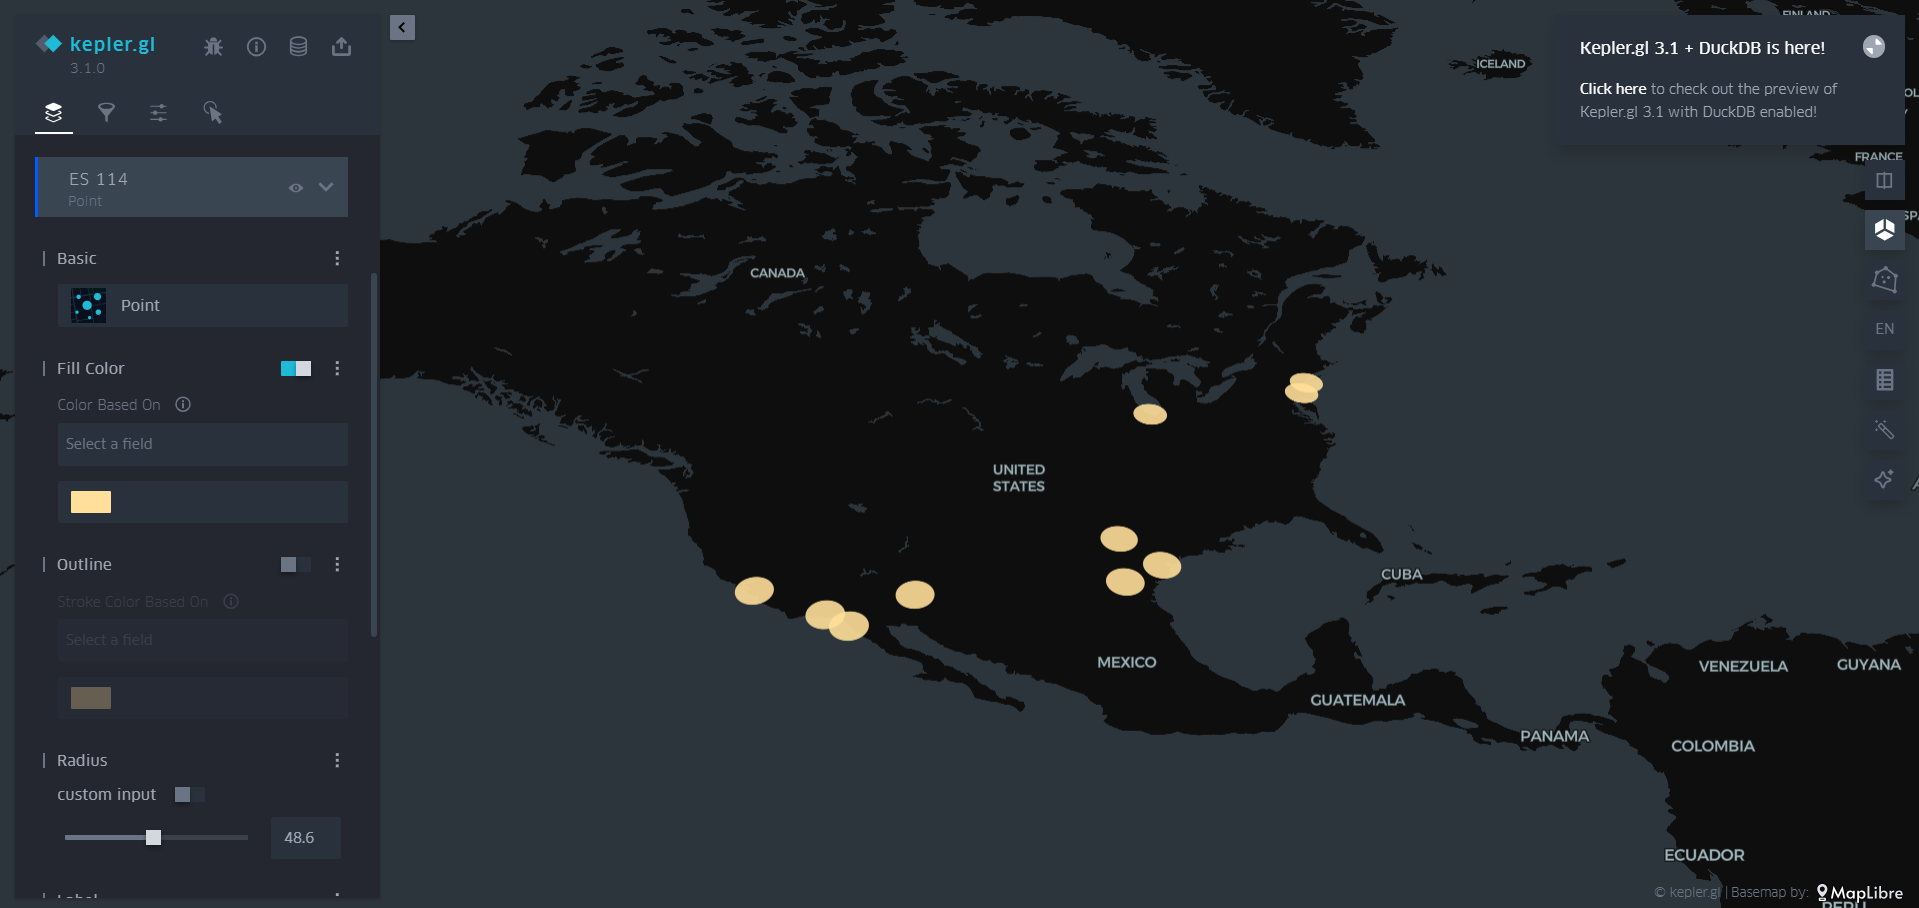
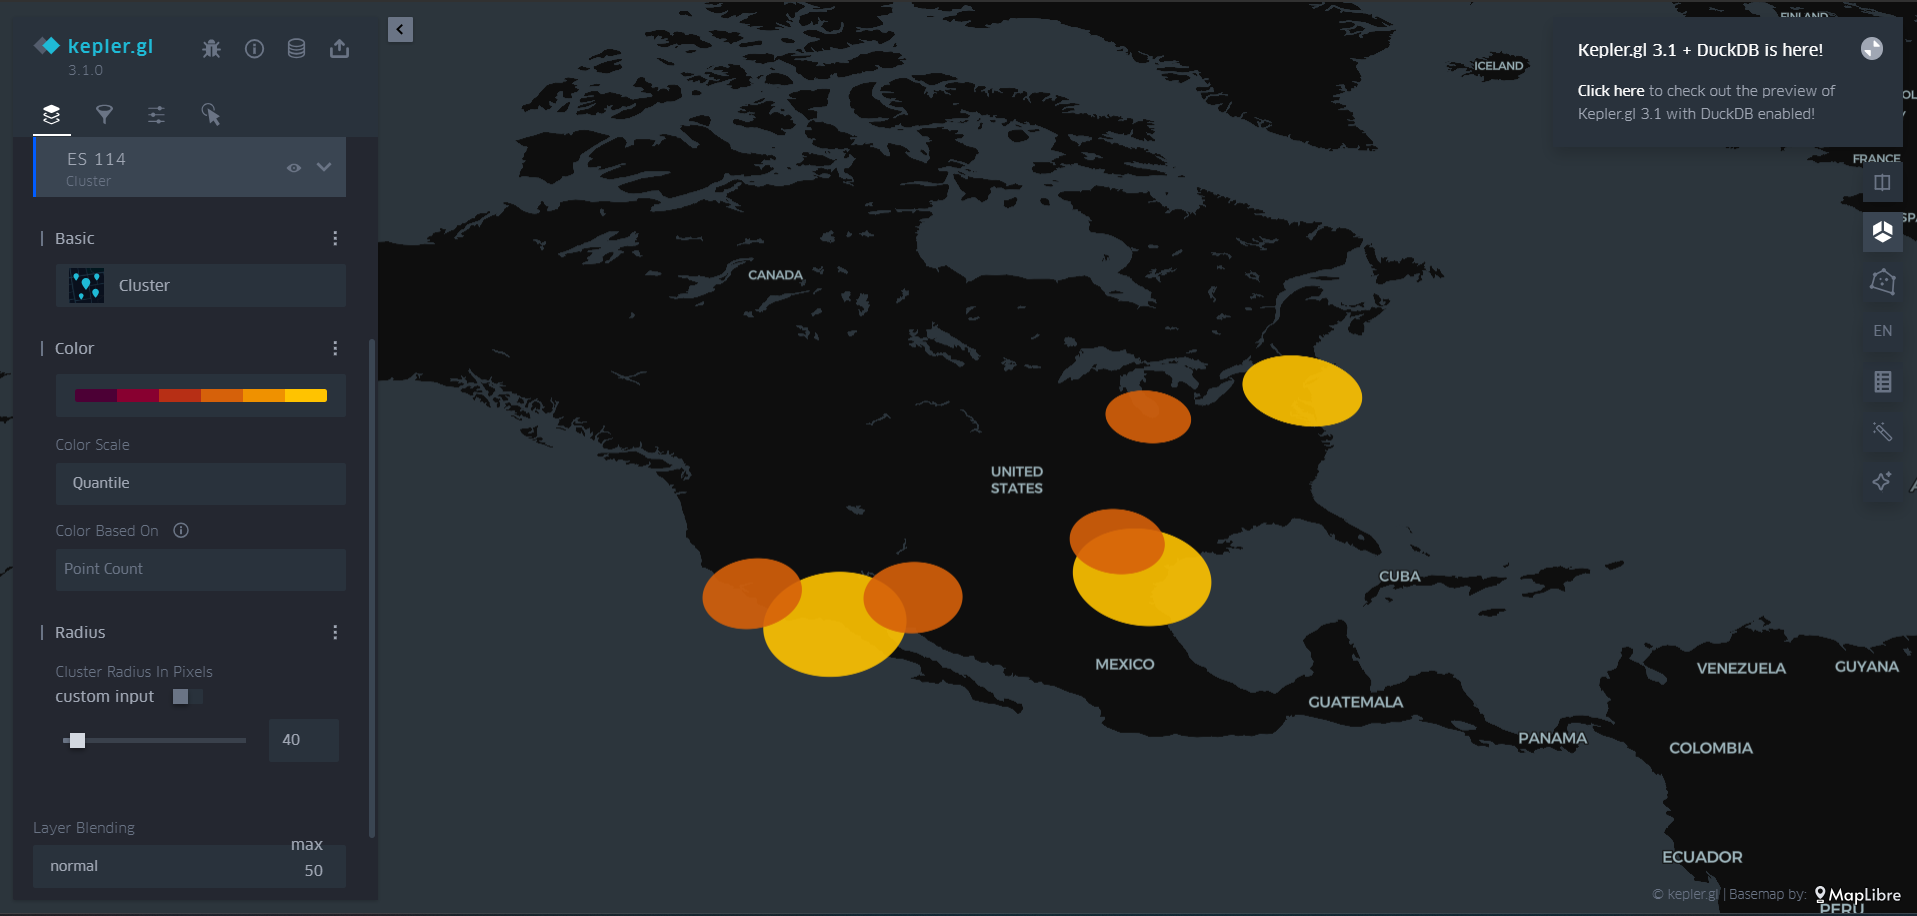
2. Multiple Layer Visualizations
Users are able to overlay multiple layers such as:
Point Layer – Plots single locations.
Heatmap Layer – Identifies data density.
Arc Layer – Displays connections between locations.
Hexbin & Grid Layers – Bins data into hexagonal or square bins.
Layers can be customized with colors, sizes, and labels.
3. Advanced Filtering & Data Exploration
Filtering allows users to concentrate on data subsets of their interest.
Interactive click and hover functionalities deliver greater insight into data points.
4. Time Animation for Dynamic Data
Time playback functionality enables visualization of how the data evolves through time.
Beneficial in monitoring movement, trends, and temporal patterns.
5. 3D Data Visualization
Facilitates elevation-based mapping of depth and perspective.
Useful for showing values such as population density or elevation.
6. Custom Styling & Theming
They are able to change colors, transparency, labels, and tooltips for improved readability.
Includes dark and light themes to accommodate various styles of visualization.
7. Exporting & Sharing Maps
Export as HTML, JSON, or images.
Share interactive maps effortlessly through URL or embed into presentations and web pages.
Screenshots:
Use Cases:
Kepler.gl is widely used across industries for analyzing and visualizing geospatial data. Some of them are:
1. Urban Planning & Smart Cities
Examine population density, traffic flow, and infrastructure.
Rationalize city designs and enhance public transport planning.
2. Transport & Mobility Analysis
Visualize fleet movement, delivery routes, and ride-sharing.
Maximize logistics and supply chains through real-time tracking information.
3. Environmental & Climate Studies
Monitor air quality pollution, forest loss, and climatic patterns.
Plot weather patterns, natural disasters, and conservation measures.
4. Retail & Business Intelligence
Find customer hotspots and locate stores optimally.
Track sales performance by location to provide enhanced marketing.
5. Public Health & Crisis Management
Track disease outbreaks and vaccination rates.
Create emergency response paths for disaster response.
6. Security & Defense
Detect crime patterns and police deployment.
Apply geospatial intelligence for border defense and monitoring.
Conclusion:
Kepler.gl is an impressive and intuitive geospatial data visualization tool. Through its simple user interface, multiple layers of visualization, robust filtering, and time animation support, it makes it easy to explore and analyze location data. For city planning, transportation, environmental research, or business analytics, Kepler.gl offers useful insights that inform sound decision-making.
Through streamlining geospatial analysis complexity, Kepler.gl enables researchers, analysts, and companies to make raw data become insightful visual stories. Its power to create shareable, interactive maps makes it a must-have for anyone handling geographic data.
References & Further Reading:
For more information on Kepler.gl, explore the following resources:
- Official Kepler.gl Website & Documentation
Kepler.gl Homepage-Get started with the tool.
Kepler.gl Documentation-Detailed guides on features, installation, and customization.
- Tutorials & Guides
Kepler.gl GitHub Repository-Source code, updates, and contributions.
Kepler.gl User Guide-Step-by-step tutorials for beginners.
- Community & Learning Resources
Kepler.gl Discussions-Community forum for troubleshooting and ideas.
Quarto template Text!